Scopes
For a few years, I worked on “scopes”, 2D plots which visualize the lightness or chrominance of an image. I built a vectorscope, something then novel to practitioners of digital photography. These changes are now part of darktable, an open source tool for working with digital photographs.
Scopes allow for visual understanding of underlying image data. Scopes expand our understanding of fine points of color science, but also elucidate the limitations of numbers in describing an image.
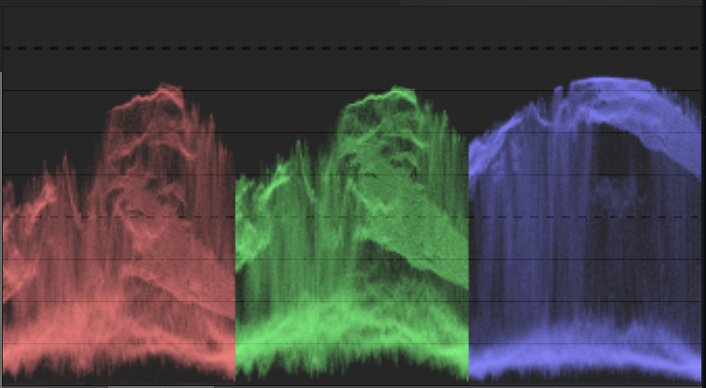
I got into the vectorscope work through prior projects to fix and create scopes. I added to darktable another scope more often seen in video than still photography, the “RGB Parade”. The RGB Parade is a variant of another classic scope taken from the oscilloscope days, a “waveform”. While darktable had an implementation of a waveform, it suffered from numerous problems (technical and visual), and the start of this work on scopes was fixing darktable's waveform scope.
Waveform and RGB Parade
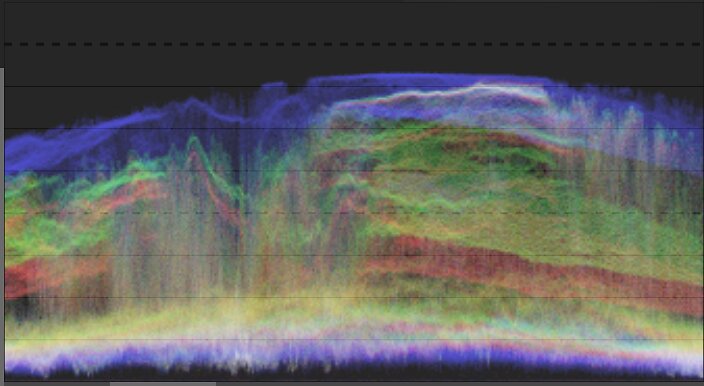
I tend to use a particular scope, known as a waveform, to see a graphical view of image tonal range. The waveform scope is more sophisticated than the more well-known histogram. While histograms show tonal range for the entire image, a waveform can show spatial information as well.
A waveform can, for example, elucidate that the left edge of an image is overexposed, but overall that the image lacks contrast. While scopes are no substitute for judging an image by eye, they can give an sense of the image to an objective standard. They are a helpful reference for both initial and nuanced corrections.
As a contributor to darktable, I tend to pull in the latest experimental changes to the code. I noticed that a change integrated into darktable on December 26, 2019 could cause the program to crash when showing the waveform scope. I also noticed that no one else had yet reported this problem. It appeared that there were no other contributors who both used the waveform scope and were testing the latest changes. I decided that I should take on a fix.
My patch for this became part of darktable on January 7, 2020. I then discovered, with the help of another darktable user, that there were some serious errors in how the waveform graph was drawn. These had been part of the darktable code for years, and the developer who had written this code was no longer active in the project. I took it on myself to fix these errors.
Now that I was looking at the waveform code carefully, I noticed other opportunities for improvement, and made these over the following weeks. This culminated, in April, 2020, when my code for an RGB Parade (a variation on the waveform scope) became part of darktable.
The waveform scope is not as commonly used by photographers as histograms. But waverforms are an essential tool for those color correcting video. I was intrigued to see what other graphs were part of the culture of video color correction which had not made their way to photography.
Vectorscope
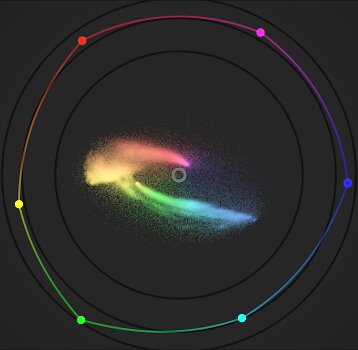
I decided to create a vectorscope. This is a graph which visualizes the hue and saturation of an image, irrespective of image luminosity or any spatial information. It is a wonderful tool for understanding image color, whether one is working on tuning an image or is teaching about color.
Vectorscopes have been around since the days when oscilloscopes were used to process video signals. They were commonly used in digital filmmaking, yet few photographers were conversant in their efficacy. Vectorscopes help to understand both the color of a particular image and overall models of color. Color balance and intensity appear readily in a vectorscope graph when they are implicit to an image itself. Color adjustments to images can be understood through examination of vectorscope graphs.
I proposed a vectorscope to the darktable community in 2020, and spent much of the summer of 2020 coding a variant. I did not complete the project that summer. This was due to both the technical demands of getting this work right and lack of outside childcare during the early months of the pandemic.
I returned to the vectorscope work in 2021. My vectorscope graph was integrated into darktable in April, 2021. I continued to make improvements to the code even after that. The finished vectorscope was part of darktable v3.6, released in July 2021.
It has been gratifying to see the uptake of this work. Other darktable developers used the vectorscope to verify—and spot errors in—their own work. Photographers who use darktable have made it something which they regularly use, and it shows up in online discussions, screenshots, and instructional videos. I've been in conversation with developers who have picked up from my work, and added other color models and various other capabilities to the code.
Color Picker and Histogram
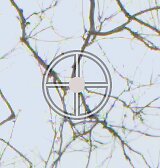
The summer after I completed the vectorscope, I worked on an overhaul of darktable's “color picker” tool. This is a related portion of the software, which allows for sampling of image color in a particular area, and for graphing this sample via one of the scopes. After considerable work, my completed code became part of darktable in August 2021, with more updates following in the ensuing weeks.
At the start of 2023, I spent some time on the code which calculates image histograms. This code had been around for a long time, and was stable. But it hadn't been updated in a while. It was optimized for the computers of more than a decade before. This meant that it was brittle -- it made assumptions which did not fit modern machines. It was hard to maintain, and could now be simplified. It might even have created memory access bugs on certain computers.
This overhaul to the histogram is a classic sort of coding work. I rarely even use the histogram (except as it appears in the background of the curves tool). The changed code produced indistinguishable results from the prior version, and did not necessarily even run faster. Yet it allowed for deleting substantial chunks of obscure code. That piece of darktable is now more pleasing, at least to programmers.
Community Work
For each part of the darktable work that is innovative, there is other work. As a long-lived tool coded by many authors over more than a decade, it always needs maintenance—the "caring" work which keeps software stable. This community work is required to lay the groundwork to make the radical changes. I've done much of this, including fixes to allow for “tethering” cameras to the computer, speed-ups to image processing, and updates to the rendering of visual elements. Much of the work is also communicating with other developers, so that we all see ways forward with our work.
This work exists on a multitude of levels: It is a pragmatic way to bring into the photographic community graphical tools which have already been proven in video. It is community work, to contribute to a thriving open source project in which an international group of photographers and coders develop remarkable tools. And on another level, this is applied color theory. It is a route to understanding perceptions of color in images and the world.
I have plunged into this work due to taking delight in the subject material and the concomitant ongoing discussions. I have learned a tremendous amount about color science through this work. It has given me a picture of the “industrial” tools that work on color.
The work is tremendously pragmatic. It is checked to the reality of producing something “correct” for the multitude of darktable users. The work is also speculative. It is a chance to re-envision what the processes of digital color photography can be.